要运行范例从 Qt Creator ,打开 欢迎 模式,然后选择范例从 范例 。更多信息,拜访 构建和运行范例 .
要创建线图表, QLineSeries 实例是需要的。让我们创建一个。
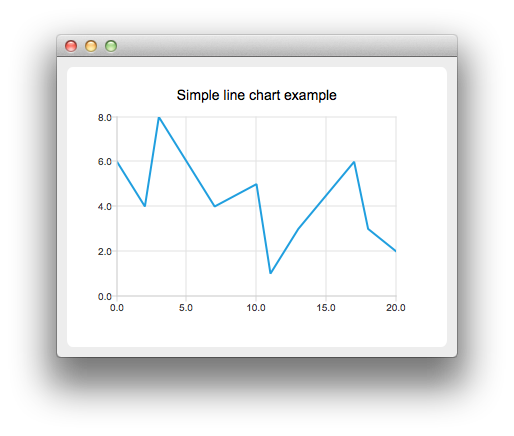
QLineSeries *series = new QLineSeries();
Then we add data to the series. We can use the append() member function or use the stream operator.
    series->append(0, 6);
    series->append(2, 4);
    series->append(3, 8);
    series->append(7, 4);
    series->append(10, 5);
    *series << QPointF(11, 1) << QPointF(13, 3) << QPointF(17, 6) << QPointF(18, 3) << QPointF(20, 2);
To present the data on the chart we need a QChart instance. We add the series to it, create the default axes, and set the title of the chart.
    QChart *chart = new QChart();
    chart->legend()->hide();
    chart->addSeries(series);
    chart->createDefaultAxes();
    chart->setTitle("Simple line chart example");
Then we create a QChartView 对象采用 QChart as a parameter. This way we don't need to create a QGraphicsView scene ourselves. We also set the Antialiasing on to have the rendered lines look nicer.
    QChartView *chartView = new QChartView(chart);
    chartView->setRenderHint(QPainter::Antialiasing);
图表展示就绪。
    QMainWindow window;
    window.setCentralWidget(chartView);
    window.resize(400, 300);
    window.show();
文件: