The
StocQt
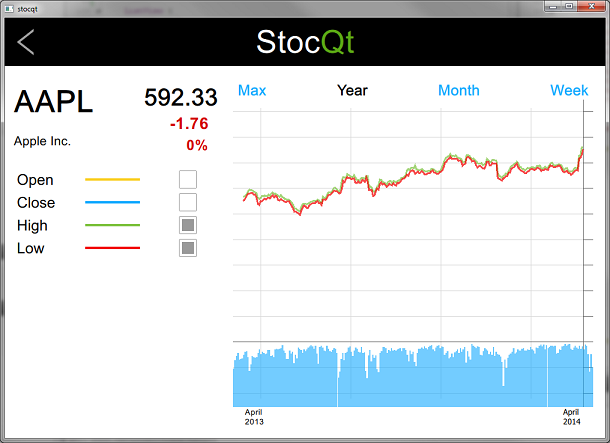
application presents a trend chart for the first stock in the list of NASDAQ-100 stocks maintained by it. It allows the user to choose another stock from the list, and fetches the required data for the selected stock by sending an
XMLHttpRequest
to http://finance.yahoo.com.
应用程序使用几种自定义类型,譬如:按钮、 CheckBox , StockChart, StockInfo, StockView, and so on. These types are used to present the stock data in a readable form and also let the user customize the trend chart. For example, the user can choose to view the yearly, monthly, or daily trends in the stock price.
应用程序使用 ObjectModel 类型以访问它依赖的 2 可视数据模型。
        ListView {
            id: root
        ...
            model: ObjectModel {
                StockListView {
                    id: listView
                    width: root.width
                    height: root.height
                }
                StockView {
                    id: stockView
                    width: root.width
                    height: root.height
                    stocklist: listView
                    stock: stock
                }
            }
        }
The StockListView model is a static data model listing the NASDAQ-100 stocks with basic information such as stockId, name, value, change, and so on. This data model is used by the application if the user wants to choose another stock from the list.
StockView is a complex data model that presents a trend chart for the selected stock. It uses another custom type, StockChart, which presents the graphical trend of the stock price using a Canvas. This data model is used for most of the time during the lifetime of the application.
Rectangle {
    id: chart
    ...
        Canvas {
            id: canvas
        ...
            onPaint: {
                numPoints = stockModel.indexOf(chart.startDate);
                if (chart.gridSize == 0)
                    chart.gridSize = numPoints
                var ctx = canvas.getContext("2d");
                ctx.globalCompositeOperation = "source-over";
                ctx.lineWidth = 1;
                drawBackground(ctx);
                if (!stockModel.ready) {
                    drawError(ctx, "No data available.");
                    return;
                }
                var highestPrice = 0;
                var highestVolume = 0;
                var lowestPrice = -1;
                var points = [];
                for (var i = numPoints, j = 0; i >= 0 ; i -= pixelSkip, j += pixelSkip) {
                    var price = stockModel.get(i);
                    if (parseFloat(highestPrice) < parseFloat(price.high))
                        highestPrice = price.high;
                    if (parseInt(highestVolume, 10) < parseInt(price.volume, 10))
                        highestVolume = price.volume;
                    if (lowestPrice < 0 || parseFloat(lowestPrice) > parseFloat(price.low))
                        lowestPrice = price.low;
                    points.push({
                                    x: j * xGridStep,
                                    open: price.open,
                                    close: price.close,
                                    high: price.high,
                                    low: price.low,
                                    volume: price.volume
                                });
                }
                if (settings.drawHighPrice)
                    drawPrice(ctx, 0, numPoints, settings.highColor, "high", points, highestPrice, lowestPrice);
                if (settings.drawLowPrice)
                    drawPrice(ctx, 0, numPoints, settings.lowColor, "low", points, highestPrice, lowestPrice);
                if (settings.drawOpenPrice)
                    drawPrice(ctx, 0, numPoints,settings.openColor, "open", points, highestPrice, lowestPrice);
                if (settings.drawClosePrice)
                    drawPrice(ctx, 0, numPoints, settings.closeColor, "close", points, highestPrice, lowestPrice);
                drawVolume(ctx, 0, numPoints, settings.volumeColor, "volume", points, highestVolume);
                drawScales(ctx, highestPrice, lowestPrice, highestVolume);
            }
        }
        Text {
            id: fromDate
            color: "#000000"
            font.family: Settings.fontFamily
            font.pointSize: 8
            Layout.alignment: Qt.AlignLeft
            text: "| " + startDate.toDateString()
        }
        Text {
            id: toDate
            color: "#000000"
            font.family: Settings.fontFamily
            font.pointSize: 8
            Layout.alignment: Qt.AlignRight
            Layout.rightMargin: canvas.tickMargin
            Layout.columnSpan: 5
            text: endDate.toDateString() + " |"
        }
    }
}
为更好地理解应用程序,使用 Qt Creator 浏览其代码。
要运行范例从 Qt Creator ,打开 欢迎 模式,然后选择范例从 范例 。更多信息,拜访 构建和运行范例 .
文件:
另请参阅 QML 应用程序 .