Manages the graphical representation of the chart's series, legends, and axes. 更多...
| import 语句: | import QtCharts 2.3 |
The ChartView type displays different series types as charts.
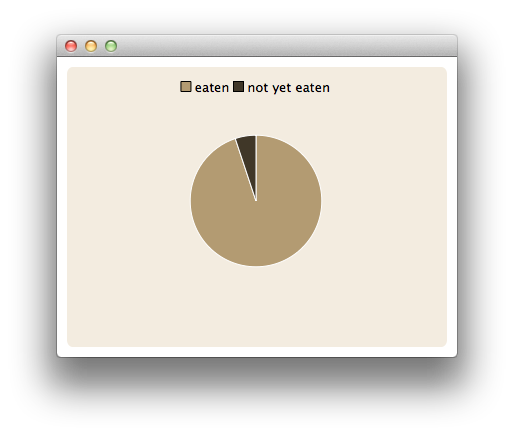
The following QML code shows how to create a simple chart with one pie series:
import QtQuick 2.0
import QtCharts 2.0
ChartView {
    width: 400
    height: 300
    theme: ChartView.ChartThemeBrownSand
    antialiasing: true
    PieSeries {
        id: pieSeries
        PieSlice { label: "eaten"; value: 94.9 }
        PieSlice { label: "not yet eaten"; value: 5.1 }
    }
}
|
animationDuration : int |
The duration of the animation for the chart.
The easing curve of the animation for the chart.
|
animationOptions : enumeration |
The animations enabled in the chart:
| 常量 | 描述 |
|---|---|
ChartView.NoAnimation
|
Animation is disabled in the chart. This is the default value. |
ChartView.GridAxisAnimations
|
Grid axis animation is enabled in the chart. |
ChartView.SeriesAnimations
|
Series animation is enabled in the chart. |
ChartView.AllAnimations
|
All animation types are enabled in the chart. |
|
axes : list < AbstractAxis > |
The axes of the chart.
|
backgroundColor : color |
The color of the chart's background. By default, the background color is specified by the chart theme.
另请参阅 theme .
|
backgroundRoundness : real |
The diameter of the rounding circle at the corners of the chart background.
|
count : int |
The number of series added to the chart.
|
dropShadowEnabled : bool |
Whether the background drop shadow effect is enabled.
若设为
true
, the background drop shadow effect is enabled. If set to
false
, it is disabled.
|
legend : 图例 |
The legend of the chart. The legend lists all the series, pie slices, and bar sets added to the chart.
The locale used to format various chart labels.
Labels are localized only when
localizeNumbers
is
true
, except for
DateTimeAxis
labels, which always use the
QLocale
set with this property.
Defaults to the application default locale at the time when the chart is constructed.
This property was introduced in QtCharts 2.0.
另请参阅 localizeNumbers .
|
localizeNumbers : bool |
Whether numbers are localized.
当
true
, all generated numbers appearing in various series and axis labels will be localized using the
QLocale
set with the
locale
property. When
false
,
C
locale is always used. Defaults to
false
.
注意: This property does not affect DateTimeAxis labels, which always use the QLocale set with the locale property.
This property was introduced in QtCharts 2.0.
另请参阅 locale .
|
margins : Margins |
The minimum margins allowed between the edge of the chart rectangle and the plot area. The margins are used for drawing the title, axes, and legend.
|
plotArea : rect |
The rectangle within which the chart is drawn.
The plot area does not include the area defined by margins. By default this will resize if inside a
ChartView
. If an explicit rectangle is set for the plot area then it will respect this, to revert back to the default behavior, then setting it to
Qt.rect(0, 0, 0, 0)
will achieve this.
另请参阅 margins .
|
plotAreaColor : color |
The color of the background of the chart's plot area. By default, the plot area background uses the chart's background color, which is specified by the chart theme.
另请参阅 backgroundColor and theme .
|
theme : enumeration |
The theme used by the chart.
A theme is a built-in collection of UI style related settings applied to all the visual elements of a chart, such as colors, pens, brushes, and fonts of series, as well as axes, title, and legend. The QML 示波器 example illustrates how to set a theme.
注意: Changing the theme will overwrite all customizations previously applied to the series.
The following values are supported:
| 常量 | 描述 |
|---|---|
ChartView.ChartThemeLight
|
The light theme, which is the default theme. |
ChartView.ChartThemeBlueCerulean
|
钴天蓝主题。 |
ChartView.ChartThemeDark
|
暗黑主题。 |
ChartView.ChartThemeBrownSand
|
The sand brown theme. |
ChartView.ChartThemeBlueNcs
|
The natural color system (NCS) blue theme. |
ChartView.ChartThemeHighContrast
|
The high contrast theme. |
ChartView.ChartThemeBlueIcy
|
The icy blue theme. |
ChartView.ChartThemeQt
|
Qt 主题。 |
|
title : string |
标题是展示在图表顶部的标题行。图表标题支持 HTML 格式。
另请参阅 titleColor .
|
titleColor : color |
The color of the title text.
|
titleFont : font |
The title font of the chart.
更多信息,见 font .
|
seriesAdded ( AbstractSeries series ) |
This signal is emitted when the series series is added to the chart.
|
seriesRemoved ( AbstractSeries series ) |
This signal is emitted when the series series is removed from the chart. The series object becomes invalid when the signal handler completes.
|
Axis axisX ( AbstractSeries series ) |
The x-axis of the series.
另请参阅 setAxisX() .
|
Axis axisY ( AbstractSeries series ) |
The y-axis of the series.
另请参阅 setAxisY() .
|
AbstractSeries createSeries ( enumeration type , string name , AbstractAxis axisX , AbstractAxis axisY ) |
Adds a series of the type type to the chart with the name name and, optionally, the axes axisX and axisY 。例如:
// lineSeries is a LineSeries object that has already been added to the ChartView; re-use its axes
var myAxisX = chartView.axisX(lineSeries);
var myAxisY = chartView.axisY(lineSeries);
var scatter = chartView.createSeries(ChartView.SeriesTypeScatter, "scatter series", myAxisX, myAxisY);
The following enumeration values can be used as values of type :
| 常量 | 描述 |
|---|---|
ChartView.SeriesTypeLine
|
A line series. |
ChartView.SeriesTypeArea
|
An area series. |
ChartView.SeriesTypeBar
|
A bar series. |
ChartView.SeriesTypeStackedBar
|
A stacked bar series. |
ChartView.SeriesTypePercentBar
|
A percent bar series. |
ChartView.SeriesTypeBoxPlot
|
A box plot series. |
ChartView.SeriesTypeCandlestick
|
A candlestick series. |
ChartView.SeriesTypePie
|
A pie series. |
ChartView.SeriesTypeScatter
|
A scatter series. |
ChartView.SeriesTypeSpline
|
A spline series. |
ChartView.SeriesTypeHorizontalBar
|
A horizontal bar series. |
ChartView.SeriesTypeHorizontalStackedBar
|
A horizontal stacked bar series. |
ChartView.SeriesTypeHorizontalPercentBar
|
A horizontal percent bar series. |
返回
true
if any series has a zoomed domain.
|
point mapToPosition ( point value , AbstractSeries series ) |
Returns the position in the chart of the value value in the series series .
|
point mapToValue ( point position , AbstractSeries series ) |
Returns the value in the series series located at the position position in the chart.
Removes all series from the chart and permanently deletes all the series objects.
|
removeSeries ( AbstractSeries series ) |
Removes the series series from the chart and permanently deletes the series object.
|
scrollDown ( real pixels ) |
Scrolls down by the number of pixels specified by pixels . This is a convenience method suitable for key navigation, for example.
|
scrollLeft ( real pixels ) |
Scrolls to left by the number of pixels specified by pixels . This is a convenience method suitable for key navigation, for example.
|
scrollRight ( real pixels ) |
Scrolls to right by by the number of pixels specified by pixels . This is a convenience method suitable for key navigation, for example.
|
scrollUp ( real pixels ) |
Scrolls up by the number of pixels specified by pixels . This is a convenience method suitable for key navigation, for example.
|
AbstractSeries series ( int index ) |
Returns the series with the index index on the chart. Together with the count property of the chart, this enables looping through the series of a chart.
另请参阅 count .
|
AbstractSeries series ( string name ) |
Returns the first series in the chart with the name name . If there is no series with that name, returns null.
|
setAxisX ( AbstractAxis axis , AbstractSeries series ) |
Sets the x-axis of the series.
另请参阅 axisX() .
|
setAxisY ( AbstractAxis axis , AbstractSeries series ) |
Sets the y-axis of the series.
另请参阅 axisY() .
|
zoom ( real factor ) |
Zooms into the chart by the custom factor factor .
A factor over 1.0 zooms into the view in and a factor between 0.0 and 1.0 zooms out of it.
Zooms into the view by a factor of two.
|
zoomIn ( rect rectangle ) |
Zooms into the view to a maximum level at which the rectangle rectangle is still fully visible.
注意: 这不支持极坐标图表。
Zooms out of the view by a factor of two.
Resets the series domains to what they were before any zoom method was called.
注意: This will also reset scrolling and explicit axis range settings specified between the first zoom operation and calling this method. If no zoom operation has been performed, this method does nothing.