Presents data as spline charts. 更多...
| import 语句: | import QtCharts 2.2 |
| 实例化: | QSplineSeries |
| 继承: | XYSeries |
样条线系列存储数据点和分段控制点需要通过 QPainterPath 来绘制样条线。会自动计算控制点,当数据改变时。算法计算点,以便可以绘制正常样条线。
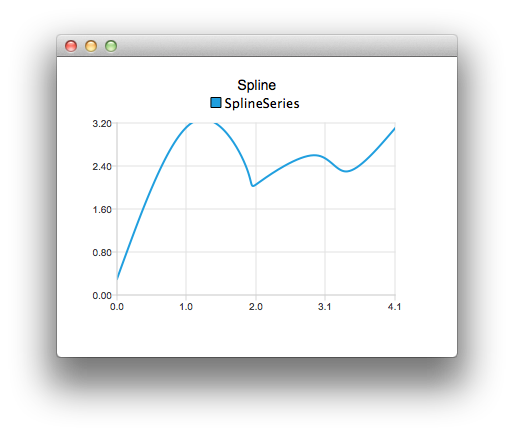
The following QML code shows how to create a simple spline chart:
ChartView {
    title: "Spline"
    anchors.fill: parent
    antialiasing: true
    SplineSeries {
        name: "SplineSeries"
        XYPoint { x: 0; y: 0.0 }
        XYPoint { x: 1.1; y: 3.2 }
        XYPoint { x: 1.9; y: 2.4 }
        XYPoint { x: 2.1; y: 2.1 }
        XYPoint { x: 2.9; y: 2.6 }
        XYPoint { x: 3.4; y: 2.3 }
        XYPoint { x: 4.1; y: 3.1 }
    }
}
控制线的帽盖样式。设为之一对于 Qt.FlatCap , Qt.SquareCap or Qt.RoundCap . By default, the cap style is Qt.SquareCap.
另请参阅 Qt::PenCapStyle .
系列的数据点数。
控制线的样式。设为之一对于 Qt.NoPen , Qt.SolidLine , Qt.DashLine , Qt.DotLine , Qt.DashDotLine ,或 Qt.DashDotDotLine 。使用 Qt.CustomDashLine QML API 不支持。默认情况下,样式为 Qt.SolidLine。
另请参阅 Qt::PenStyle .
线的宽度。默认情况下,宽度为 2.0。