By default the application uses static test data to mimic a weather forecast. You can also obtain an application id from http://www.worldweatheronline.com/ to get access to weather API provided by World Weather Online. You can then give your application id as a parameter to the Qml Weather executable to make it use live data.
例如:
bin\qmlweather.exe 1234567890abcdef123456
要运行范例从 Qt Creator ,打开 欢迎 模式,然后选择范例从 范例 。更多信息,拜访 构建和运行范例 .
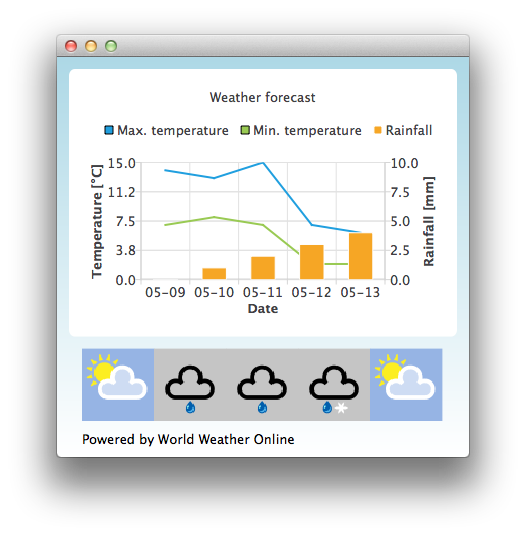
范例应用程序使用 ChartView and a some series to visualize weather data:
ChartView {
    id: chartView
    title: "Weather forecast"
    BarCategoryAxis {
        id: barCategoriesAxis
        titleText: "Date"
    }
    ValueAxis{
        id: valueAxisY2
        min: 0
        max: 10
        titleText: "Rainfall [mm]"
    }
    ValueAxis {
        id: valueAxisX
        // Hide the value axis; it is only used to map the line series to bar categories axis
        visible: false
        min: 0
        max: 5
    }
    ValueAxis{
        id: valueAxisY
        min: 0
        max: 15
        titleText: "Temperature [°C]"
    }
    LineSeries {
        id: maxTempSeries
        axisX: valueAxisX
        axisY: valueAxisY
        name: "Max. temperature"
    }
    LineSeries {
        id: minTempSeries
        axisX: valueAxisX
        axisY: valueAxisY
        name: "Min. temperature"
    }
    BarSeries {
        id: myBarSeries
        axisX: barCategoriesAxis
        axisYRight: valueAxisY2
        BarSet {
            id: rainfallSet
            label: "Rainfall"
        }
    }
To get data with weather forecast data, we make an HTTP GET request to World Weather Online. We request the response in JSON data format.
// Make HTTP GET request and parse the result
var xhr = new XMLHttpRequest;
xhr.open("GET",
         "http://free.worldweatheronline.com/feed/weather.ashx?q=Jyv%c3%a4skyl%c3%a4,Finland&format=json&num_of_days=5&key="
         + weatherAppKey);
xhr.onreadystatechange = function() {
    if (xhr.readyState == XMLHttpRequest.DONE) {
        var a = JSON.parse(xhr.responseText);
        parseWeatherData(a);
    }
}
xhr.send();
The JSON response contains an array of forecast data:
// Loop through the parsed JSON
for (var i in weatherData.data.weather) {
    var weatherObj = weatherData.data.weather[i];
That is then used as input data for our series and a ListModel we use as a container for weather icon URLs:
// Store temperature values, rainfall and weather icon.
// The temperature values begin from 0.5 instead of 0.0 to make the start from the
// middle of the rainfall bars. This makes the temperature lines visually better
// synchronized with the rainfall bars.
maxTempSeries.append(Number(i) + 0.5, weatherObj.tempMaxC);
minTempSeries.append(Number(i) + 0.5, weatherObj.tempMinC);
rainfallSet.append(i, weatherObj.precipMM);
weatherImageModel.append({"imageSource":weatherObj.weatherIconUrl[0].value});
文件: