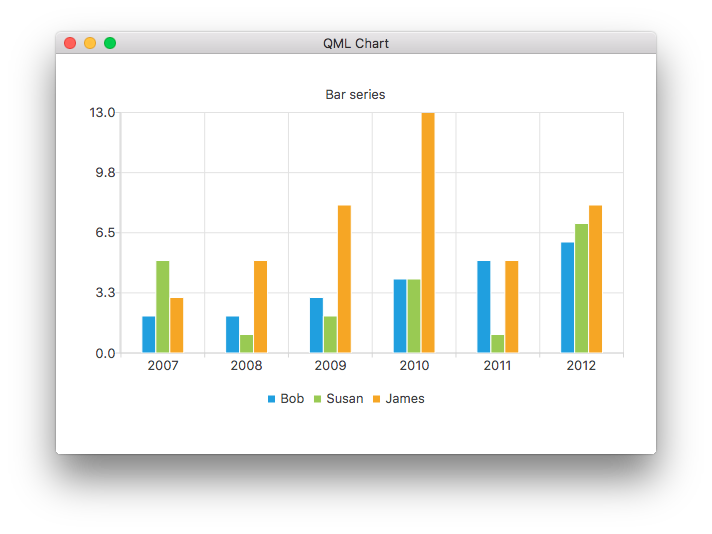
将一系列数据按类别分组呈现为垂直条形。 更多...
| import 语句: | import QtCharts 2.3 |
| 实例化: | QBarSeries |
| 继承: | AbstractBarSeries |
The data is drawn as a series of vertical bars grouped by category, with one bar per category from each bar set added to the series.
The following QML code snippet shows how to create a simple grouped bar chart:
ChartView {
    title: "Bar series"
    anchors.fill: parent
    legend.alignment: Qt.AlignBottom
    antialiasing: true
    BarSeries {
        id: mySeries
        axisX: BarCategoryAxis { categories: ["2007", "2008", "2009", "2010", "2011", "2012" ] }
        BarSet { label: "Bob"; values: [2, 2, 3, 4, 5, 6] }
        BarSet { label: "Susan"; values: [5, 1, 2, 4, 1, 7] }
        BarSet { label: "James"; values: [3, 5, 8, 13, 5, 8] }
    }
}
