Presents a series of categorized data as a percentage of each category. 更多...
| import 语句: | import QtCharts 2.3 |
| 实例化: | QPercentBarSeries |
| 继承: | AbstractBarSeries |
The data is drawn as a series of uniformly sized vertically stacked bars, with one bar per category. Each bar set added to the series contributes a single segment to each stacked bar. The segment size corresponds to the percentage of the segment value compared with the total value of all segments in the stack. Bars with zero value are not drawn.
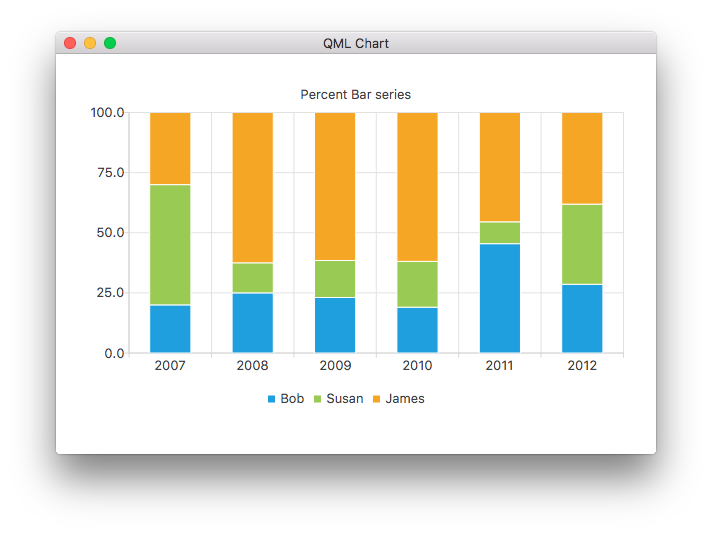
The following QML code snippet shows how to create a simple percent bar chart:
ChartView {
    title: "Percent Bar series"
    anchors.fill: parent
    legend.alignment: Qt.AlignBottom
    antialiasing: true
    PercentBarSeries {
        axisX: BarCategoryAxis { categories: ["2007", "2008", "2009", "2010", "2011", "2012" ] }
        BarSet { label: "Bob"; values: [2, 2, 3, 4, 5, 6] }
        BarSet { label: "Susan"; values: [5, 1, 2, 4, 1, 7] }
        BarSet { label: "James"; values: [3, 5, 8, 13, 5, 8] }
    }
}