The ScatterSeries type presents data in scatter charts. 更多...
| import 语句: | import QtCharts 2.3 |
| 实例化: | QScatterSeries |
| 继承: | XYSeries |
The scatter data is displayed as a collection of points on the chart. For each point, two values are specified that determine its position on the horizontal axis and the vertical axis.
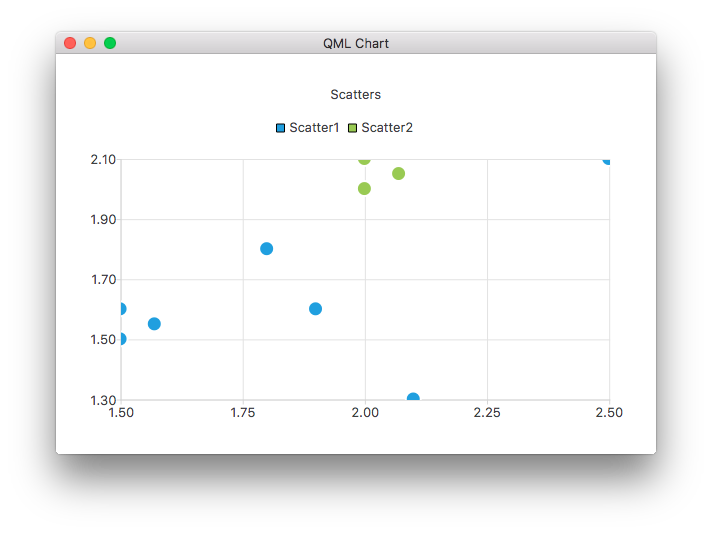
The following QML code shows how to create a chart with two simple scatter series:
ChartView {
    title: "Scatters"
    anchors.fill: parent
    antialiasing: true
    ScatterSeries {
        id: scatter1
        name: "Scatter1"
        XYPoint { x: 1.5; y: 1.5 }
        XYPoint { x: 1.5; y: 1.6 }
        XYPoint { x: 1.57; y: 1.55 }
        XYPoint { x: 1.8; y: 1.8 }
        XYPoint { x: 1.9; y: 1.6 }
        XYPoint { x: 2.1; y: 1.3 }
        XYPoint { x: 2.5; y: 2.1 }
    }
    ScatterSeries {
        name: "Scatter2"
更多信息,见 QML 图表范例 .
|
borderColor : color |
The color used to draw the marker borders.
|
borderWidth : real |
The width of the border line. By default, the width is 2.0.
|
brushFilename : string |
The name of the file used as a brush for the series.
|
count : int |
系列的数据点数。
|
markerShape : enumeration |
The shape used when rendering marker items:
| 常量 | 描述 |
|---|---|
ScatterSeries.MarkerShapeCircle
|
The marker is a circle. This is the default value. |
ScatterSeries.MarkerShapeRectangle
|
The marker is a rectangle. |
|
markerSize : real |
The size of the marker used to render the points in the series. The default size is 15.0.