Presents data in area charts. 更多...
| import 语句: | import QtCharts 2.2 |
| 实例化: | QAreaSeries |
| 继承: | AbstractSeries |
An area series is used to show quantitative data. It is based on a line series, in the way that the area between the boundary lines is emphasized with color. The LineSeries type defines the upper boundary of the area. The area chart is drawn using the bottom of the plot area as the lower boundary by default. Instead of the bottom of the plot area, the lower boundary can be specified by another line. In that case, the AreaSeries should use two LineSeries 类型。
注意: The terms upper and lower boundary can be misleading in cases where the value of the lower boundary is greater than that of the upper boundary. The main point is that the area between these two boundary lines will be filled.
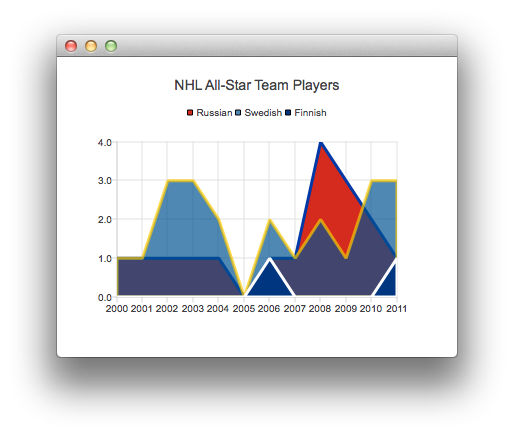
The following QML shows how to create a simple area chart:
ChartView {
    title: "NHL All-Star Team Players"
    anchors.fill: parent
    antialiasing: true
    ValueAxis {
        id: valueAxis
        min: 2000
        max: 2011
        tickCount: 12
        labelFormat: "%.0f"
    }
    AreaSeries {
        name: "Russian"
        color: "#FFD52B1E"
        borderColor: "#FF0039A5"
        borderWidth: 3
        axisX: valueAxis
        upperSeries: LineSeries {
            XYPoint { x: 2000; y: 1 }
            XYPoint { x: 2001; y: 1 }
            XYPoint { x: 2002; y: 1 }
            XYPoint { x: 2003; y: 1 }
            XYPoint { x: 2004; y: 1 }
            XYPoint { x: 2005; y: 0 }
            XYPoint { x: 2006; y: 1 }
            XYPoint { x: 2007; y: 1 }
            XYPoint { x: 2008; y: 4 }
            XYPoint { x: 2009; y: 3 }
            XYPoint { x: 2010; y: 2 }
            XYPoint { x: 2011; y: 1 }
        }
    }
注意: Adding the same line series to a chart and area series is not supported. The series used as boundary lines should be defined only for the area series.
|
axisAngular : AbstractAxis |
The angular axis used for the series, drawn around the polar chart view.
另请参阅 axisX and PolarChartView .
|
axisRadial : AbstractAxis |
The radial axis used for the series, drawn inside the polar chart view.
另请参阅 axisY and PolarChartView .
|
axisX : AbstractAxis |
The x-axis used for the series. If you leave both axisX and axisXTop undefined, a value axis is created for the series.
|
axisXTop : AbstractAxis |
The x-axis used for the series, drawn on top of the chart view.
注意: You can only provide either axisX or axisXTop, not both.
另请参阅 axisX .
|
axisY : AbstractAxis |
The y-axis used for the series. If you leave both axisY and axisYRight undefined, a value axis is created for the series.
另请参阅 axisYRight and ValueAxis .
|
axisYRight : AbstractAxis |
The y-axis used for the series, drawn to the right on the chart view.
注意: You can only provide either axisY or axisYRight, not both.
另请参阅 axisY .
Line (pen) color of the series.
The width of the border line. By default, the width is 2.0.
The name of the file used as a brush image for the series.
Fill (brush) color of the series.
|
lowerSeries : LineSeries |
The lower one of the two line series used to define area series boundaries.
注意: 若 AreaSeries was constructed without a lowerSeries, this is null.
Defines the clipping for data point labels. True by default. The labels on the edge of the plot area are cut when clipping is enabled.
另请参阅 pointLabelsVisible .
Defines the color used for data point labels. By default, the color is the color of the brush defined for labels in the theme.
另请参阅 pointLabelsFormat .
Defines the font used for data point labels.
另请参阅 pointLabelsFormat .
The format used for showing labels with series points.
另请参阅 QAreaSeries::pointLabelsFormat , pointLabelsVisible , pointLabelsFont ,和 pointLabelsColor .
Defines the visibility of data point labels.
另请参阅 pointLabelsFormat and pointLabelsClipping .
|
upperSeries : LineSeries |
The upper one of the two line series used to define area series boundaries.
This signal is emitted when the user triggers a press on point by clicking it in an area chart.
The corresponding signal handler is
onClicked
.
另请参阅 pressed , released ,和 doubleClicked .
This signal is emitted when the user triggers the first press in an area chart by doubleclicking point .
The corresponding signal handler is
onDoubleClicked
.
另请参阅 pressed , released ,和 clicked .
This signal is emitted when the user hovers the mouse cursor over a series or moves it away from the series.
point
shows the origin (coordinate) of the hover event.
state
is
true
when the cursor hovers over the series and turns
false
when it moves away from the series.
The corresponding signal handler is
onHovered
.
This signal is emitted when the user presses the point specified by point in an area chart.
The corresponding signal handler is
onPressed
.
另请参阅 clicked , released ,和 doubleClicked .
This signal is emitted when the user releases a press that was triggered on point in an area chart.
The corresponding signal handler is
onReleased
.
另请参阅 pressed , clicked ,和 doubleClicked .