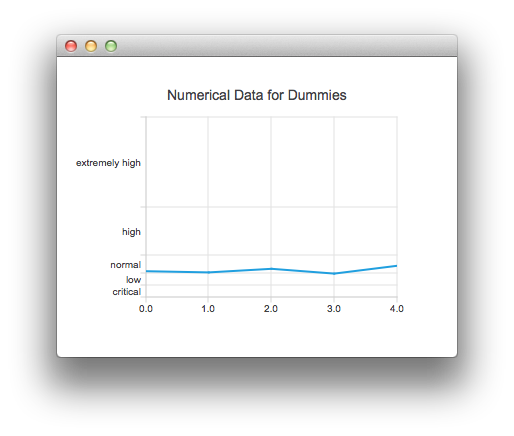
CategoryAxis places named ranges on the axis. 更多...
| import 语句: | import QtCharts 2.2 |
| 实例化: | QCategoryAxis |
| 继承: | AbstractAxis |
This type can be used to explain the underlying data by adding labeled categories. The widths of the category ranges can be specified freely.
例如:

ChartView {
    title: "Numerical Data for Dummies"
    anchors.fill: parent
    legend.visible: false
    antialiasing: true
    LineSeries {
        axisY: CategoryAxis {
            min: 0
            max: 30
            CategoryRange {
                label: "critical"
                endValue: 2
            }
            CategoryRange {
                label: "low"
                endValue: 4
            }
            CategoryRange {
                label: "normal"
                endValue: 7
            }
            CategoryRange {
                label: "high"
                endValue: 15
            }
            CategoryRange {
                label: "extremely high"
                endValue: 30
            }
        }
        XYPoint { x: 0; y: 4.3 }
        XYPoint { x: 1; y: 4.1 }
        XYPoint { x: 2; y: 4.7 }
        XYPoint { x: 3; y: 3.9 }
        XYPoint { x: 4; y: 5.2 }
    }
}
The category labels as a list of strings.
The number of categories.
The position of the category labels. The labels in the beginning and in the end of the axes may overlap other axes' labels when positioned on value.
| 常量 | 描述 |
|---|---|
CategoryAxis.AxisLabelsPositionCenter
|
Labels are centered to category. |
CategoryAxis.AxisLabelsPositionOnValue
|
Labels are positioned to the high end limit of the category. |
The low end of the first category on the axis.
Appends a new category to the axis with the label label . A category label has to be unique. endValue specifies the high end limit of the category. It has to be greater than the high end limit of the previous category. Otherwise the method returns without adding a new category.
Removes a category specified by the label label from the axis.
Replaces an existing category label specified by oldLabel with newLabel . If the old label does not exist, the method returns without making any changes.