要运行范例从 Qt Creator ,打开 欢迎 模式,然后选择范例从 范例 。更多信息,拜访 构建和运行范例 .
To create scatter charts, a QScatterSeries instance is needed. Here we create a scatter series instance, and set the type and width of outline for the scatter points.
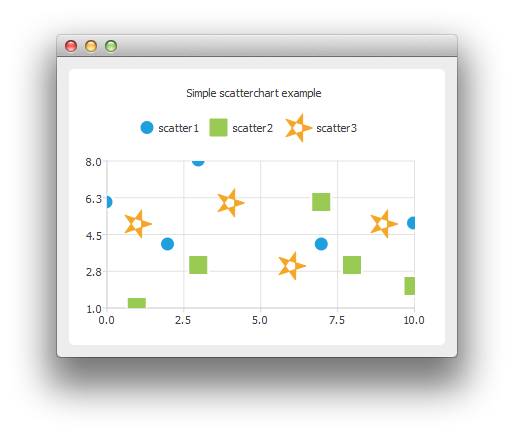
QScatterSeries *series0 = new QScatterSeries();
series0->setName("scatter1");
series0->setMarkerShape(QScatterSeries::MarkerShapeCircle);
series0->setMarkerSize(15.0);
QScatterSeries *series1 = new QScatterSeries();
series1->setName("scatter2");
series1->setMarkerShape(QScatterSeries::MarkerShapeRectangle);
series1->setMarkerSize(20.0);
QScatterSeries *series2 = new QScatterSeries();
series2->setName("scatter3");
series2->setMarkerShape(QScatterSeries::MarkerShapeRectangle);
series2->setMarkerSize(30.0);
We add the data to be shown. We can use the append() member function or use the stream operator.
series0->append(0, 6);
series0->append(2, 4);
series0->append(3, 8);
series0->append(7, 4);
series0->append(10, 5);
*series1 << QPointF(1, 1) << QPointF(3, 3) << QPointF(7, 6) << QPointF(8, 3) << QPointF(10, 2);
*series2 << QPointF(1, 5) << QPointF(4, 6) << QPointF(6, 3) << QPointF(9, 5);
We can define the brush of the scatter series to be an image. Here the image is a star created using QPainterPath .
QPainterPath starPath;
starPath.moveTo(28, 15);
for (int i = 1; i < 5; ++i) {
    starPath.lineTo(14 + 14 * qCos(0.8 * i * Pi),
                    15 + 14 * qSin(0.8 * i * Pi));
}
starPath.closeSubpath();
QImage star(30, 30, QImage::Format_ARGB32);
star.fill(Qt::transparent);
QPainter painter(&star);
painter.setRenderHint(QPainter::Antialiasing);
painter.setPen(QRgb(0xf6a625));
painter.setBrush(painter.pen().color());
painter.drawPath(starPath);
series2->setBrush(star);
series2->setPen(QColor(Qt::transparent));
In the end we enable anti-aliasing, set the chart title, and add the scatter series onto the chart. We also disable drop shadow, because it would not look good on an application with only chart view shown.
setRenderHint(QPainter::Antialiasing);
chart()->addSeries(series0);
chart()->addSeries(series1);
chart()->addSeries(series2);
chart()->setTitle("Simple scatterchart example");
chart()->createDefaultAxes();
chart()->setDropShadowEnabled(false);
We can also use the scatter points as legend markers.
chart()->legend()->setMarkerShape(QLegend::MarkerShapeFromSeries);
图表展示就绪。
    ChartView *chartView = new ChartView();
    QMainWindow window;
    window.setCentralWidget(chartView);
    window.resize(400, 300);
    window.show();
文件: