The Q3DBars class provides methods for rendering 3D bar graphs. 更多...
| 头: | #include <Q3DBars> |
| Since: | QtDataVisualization 1.0 |
| 继承: | QAbstract3DGraph |
|
|
| Q3DBars (const QSurfaceFormat * format = Q_NULLPTR, QWindow * parent = Q_NULLPTR) | |
| virtual | ~Q3DBars () |
| void | addAxis (QAbstract3DAxis * axis ) |
| void | addSeries (QBar3DSeries * series ) |
| QList<QAbstract3DAxis *> | axes () const |
| QSizeF | barSpacing () const |
| float | barThickness () const |
| QCategory3DAxis * | columnAxis () const |
| float | floorLevel () const |
| void | insertSeries (int index , QBar3DSeries * series ) |
| bool | isBarSpacingRelative () const |
| bool | isMultiSeriesUniform () const |
| QBar3DSeries * | primarySeries () const |
| void | releaseAxis (QAbstract3DAxis * axis ) |
| void | removeSeries (QBar3DSeries * series ) |
| QCategory3DAxis * | rowAxis () const |
| QBar3DSeries * | selectedSeries () const |
| QList<QBar3DSeries *> | seriesList () const |
| void | setBarSpacing (const QSizeF & spacing ) |
| void | setBarSpacingRelative (bool relative ) |
| void | setBarThickness (float thicknessRatio ) |
| void | setColumnAxis (QCategory3DAxis * axis ) |
| void | setFloorLevel (float level ) |
| void | setMultiSeriesUniform (bool uniform ) |
| void | setPrimarySeries (QBar3DSeries * series ) |
| void | setRowAxis (QCategory3DAxis * axis ) |
| void | setValueAxis (QValue3DAxis * axis ) |
| QValue3DAxis * | valueAxis () const |
| void | barSpacingChanged (const QSizeF & spacing ) |
| void | barSpacingRelativeChanged (bool relative ) |
| void | barThicknessChanged (float thicknessRatio ) |
| void | columnAxisChanged (QCategory3DAxis * axis ) |
| void | floorLevelChanged (float level ) |
| void | multiSeriesUniformChanged (bool uniform ) |
| void | primarySeriesChanged (QBar3DSeries * series ) |
| void | rowAxisChanged (QCategory3DAxis * axis ) |
| void | selectedSeriesChanged (QBar3DSeries * series ) |
| void | valueAxisChanged (QValue3DAxis * axis ) |
The Q3DBars class provides methods for rendering 3D bar graphs.
This class enables developers to render bar graphs in 3D and to view them by rotating the scene freely. Rotation is done by holding down the right mouse button and moving the mouse. Zooming is done by mouse wheel. Selection, if enabled, is done by left mouse button. The scene can be reset to default camera view by clicking mouse wheel. In touch devices rotation is done by tap-and-move, selection by tap-and-hold and zoom by pinch.
If no axes are set explicitly to Q3DBars , temporary default axes with no labels are created. These default axes can be modified via axis accessors, but as soon any axis is set explicitly for the orientation, the default axis for that orientation is destroyed.
Q3DBars supports more than one series visible at the same time. It is not necessary for all series to have the same amount of rows and columns. Row and column labels are taken from the first added series, unless explicitly defined to row and column axes.
First, construct an instance of
Q3DBars
. Since we are running the graph as top level window in this example, we need to clear the
Qt::FramelessWindowHint
flag, which gets set by default:
Q3DBars bars;
bars.setFlags(bars.flags() ^ Qt::FramelessWindowHint);
After constructing Q3DBars , you can set the data window by changing the range on the row and column axes. It is not mandatory, as data window will default to showing all of the data in the series. If the amount of data is large, it is usually preferable to show just a portion of it. For the example, let's set the data window to show first five rows and columns:
bars.rowAxis()->setRange(0, 4);
bars.columnAxis()->setRange(0, 4);
Now Q3DBars is ready to receive data to be rendered. Create a series with one row of 5 values:
QBar3DSeries *series = new QBar3DSeries;
QBarDataRow *data = new QBarDataRow;
*data << 1.0f << 3.0f << 7.5f << 5.0f << 2.2f;
series->dataProxy()->addRow(data);
bars.addSeries(series);
注意: We set the data window to 5 x 5, but we are adding only one row of data. This is ok, the rest of the rows will just be blank.
Finally you will need to set it visible:
bars.show();
The complete code needed to create and display this graph is:
#include <QtDataVisualization>
using namespace QtDataVisualization;
int main(int argc, char **argv)
{
    QGuiApplication app(argc, argv);
    Q3DBars bars;
    bars.setFlags(bars.flags() ^ Qt::FramelessWindowHint);
    bars.rowAxis()->setRange(0, 4);
    bars.columnAxis()->setRange(0, 4);
    QBar3DSeries *series = new QBar3DSeries;
    QBarDataRow *data = new QBarDataRow;
    *data << 1.0f << 3.0f << 7.5f << 5.0f << 2.2f;
    series->dataProxy()->addRow(data);
    bars.addSeries(series);
    bars.show();
    return app.exec();
}
And this is what those few lines of code produce:
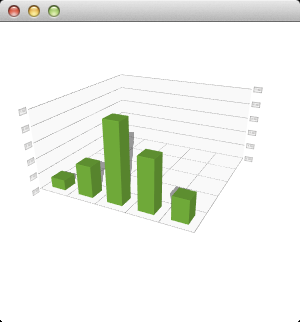
The scene can be rotated, zoomed into, and a bar can be selected to view its value, but no other interaction is included in this minimal code example. You can learn more by familiarizing yourself with the examples provided, like the 条形范例 .
另请参阅 Q3DScatter , Q3DSurface ,和 Qt Data Visualization C++ 类 .
X 和 Z 维度的条形间距。
Preset to
(1.0, 1.0)
by default. Spacing is affected by the
barSpacingRelative
特性。
访问函数:
| QSizeF | barSpacing () const |
| void | setBarSpacing (const QSizeF & spacing ) |
通知程序信号:
| void | barSpacingChanged (const QSizeF & spacing ) |
另请参阅 barSpacingRelative and multiSeriesUniform .
This property holds whether spacing is absolute or relative to bar thickness.
若它是
true
,值
0.0
means that the bars are placed side-to-side,
1.0
means that a space as wide as the thickness of one bar is left between the bars, and so on. Preset to
true
.
访问函数:
| bool | isBarSpacingRelative () const |
| void | setBarSpacingRelative (bool relative ) |
通知程序信号:
| void | barSpacingRelativeChanged (bool relative ) |
This property holds the bar thickness ratio between the X and Z dimensions.
值
1.0
means that the bars are as wide as they are deep, whereas
0.5
makes them twice as deep as they are wide. Preset to
1.0
在默认情况下。
访问函数:
| float | barThickness () const |
| void | setBarThickness (float thicknessRatio ) |
通知程序信号:
| void | barThicknessChanged (float thicknessRatio ) |
This property holds the axis attached to the active column.
访问函数:
| QCategory3DAxis * | columnAxis () const |
| void | setColumnAxis (QCategory3DAxis * axis ) |
通知程序信号:
| void | columnAxisChanged (QCategory3DAxis * axis ) |
This property holds the floor level for the bar graph in Y-axis data coordinates.
The actual floor level will be restricted by the Y-axis minimum and maximum values. Defaults to zero.
访问函数:
| float | floorLevel () const |
| void | setFloorLevel (float level ) |
通知程序信号:
| void | floorLevelChanged (float level ) |
This property holds whether bars are to be scaled with proportions set to a single series bar even if there are multiple series displayed.
若设为
true
,
bar spacing
will be correctly applied only to the X-axis. Preset to
false
在默认情况下。
访问函数:
| bool | isMultiSeriesUniform () const |
| void | setMultiSeriesUniform (bool uniform ) |
通知程序信号:
| void | multiSeriesUniformChanged (bool uniform ) |
This property holds the primary series of the graph.
访问函数:
| QBar3DSeries * | primarySeries () const |
| void | setPrimarySeries (QBar3DSeries * series ) |
通知程序信号:
| void | primarySeriesChanged (QBar3DSeries * series ) |
This property holds the axis attached to the active row.
访问函数:
| QCategory3DAxis * | rowAxis () const |
| void | setRowAxis (QCategory3DAxis * axis ) |
通知程序信号:
| void | rowAxisChanged (QCategory3DAxis * axis ) |
This property holds the selected series or a null value.
若
selectionMode
拥有
SelectionMultiSeries
flag set, this property holds the series that owns the selected bar.
访问函数:
| QBar3DSeries * | selectedSeries () const |
通知程序信号:
| void | selectedSeriesChanged (QBar3DSeries * series ) |
Sets the active value axis (the Y-axis) to axis . Implicitly calls addAxis () to transfer the ownership of axis to this graph.
若 axis is null, a temporary default axis with no labels and an automatically adjusting range is created. This temporary axis is destroyed if another axis is set explicitly to the same orientation.
访问函数:
| QValue3DAxis * | valueAxis () const |
| void | setValueAxis (QValue3DAxis * axis ) |
通知程序信号:
| void | valueAxisChanged (QValue3DAxis * axis ) |
另请参阅 addAxis () 和 releaseAxis ().
构造新的 3D 条形图采用可选 parent 窗口和表面 format .
[虚拟]
Q3DBars::
~Q3DBars
()
销毁 3D 条形图。
添加 axis to the graph. The axes added via addAxis are not yet taken to use, addAxis is simply used to give the ownership of the axis to the graph. The axis must not be null or added to another graph.
另请参阅 releaseAxis (), setValueAxis (), setRowAxis (),和 setColumnAxis ().
添加 series to the graph. A graph can contain multiple series, but only one set of axes, so the rows and columns of all series must match for the visualized data to be meaningful. If the graph has multiple visible series, only the primary series will generate the row or column labels on the axes in cases where the labels are not explicitly set to the axes. If the newly added series has specified a selected bar, it will be highlighted and any existing selection will be cleared. Only one added series can have an active selection.
/sa seriesList (), primarySeries
返回所有添加轴的列表。
另请参阅 addAxis ().
插入 series into the position index in the series list. If the series has already been added to the list, it is moved to the new index .
注意: When moving a series to a new index that is after its old index, the new position in list is calculated as if the series was still in its old index, so the final index is actually the index decremented by one.
另请参阅 addSeries () 和 seriesList ().
Releases the ownership of the axis back to the caller, if it is added to this graph. If the released axis is in use, a new default axis will be created and set active.
If the default axis is released and added back later, it behaves as any other axis would.
另请参阅 addAxis (), setValueAxis (), setRowAxis (),和 setColumnAxis ().
移除 series 从图形。
Returns the list of series added to this graph.
Sets the axis of the active column to axis . Implicitly calls addAxis () to transfer the ownership of the axis to this graph.
若 axis is null, a temporary default axis with no labels is created. This temporary axis is destroyed if another axis is set explicitly to the same orientation.
注意: setter 函数对于特性 columnAxis .
另请参阅 columnAxis (), addAxis (),和 releaseAxis ().
集 series as the primary series of the graph. The primary series determines the row and column axis labels when the labels are not explicitly set to the axes.
If the specified series is not yet added to the graph, setting it as the primary series will also implicitly add it to the graph.
If the primary series itself is removed from the graph, this property resets to default.
若 series is null, this property resets to default. Defaults to the first added series or zero if no series are added to the graph.
注意: setter 函数对于特性 primarySeries .
另请参阅 primarySeries ().
Sets the axis of the active row to axis . Implicitly calls addAxis () to transfer the ownership of the axis to this graph.
若 axis is null, a temporary default axis with no labels is created. This temporary axis is destroyed if another axis is set explicitly to the same orientation.
注意: setter 函数对于特性 rowAxis .
另请参阅 rowAxis (), addAxis (),和 releaseAxis ().