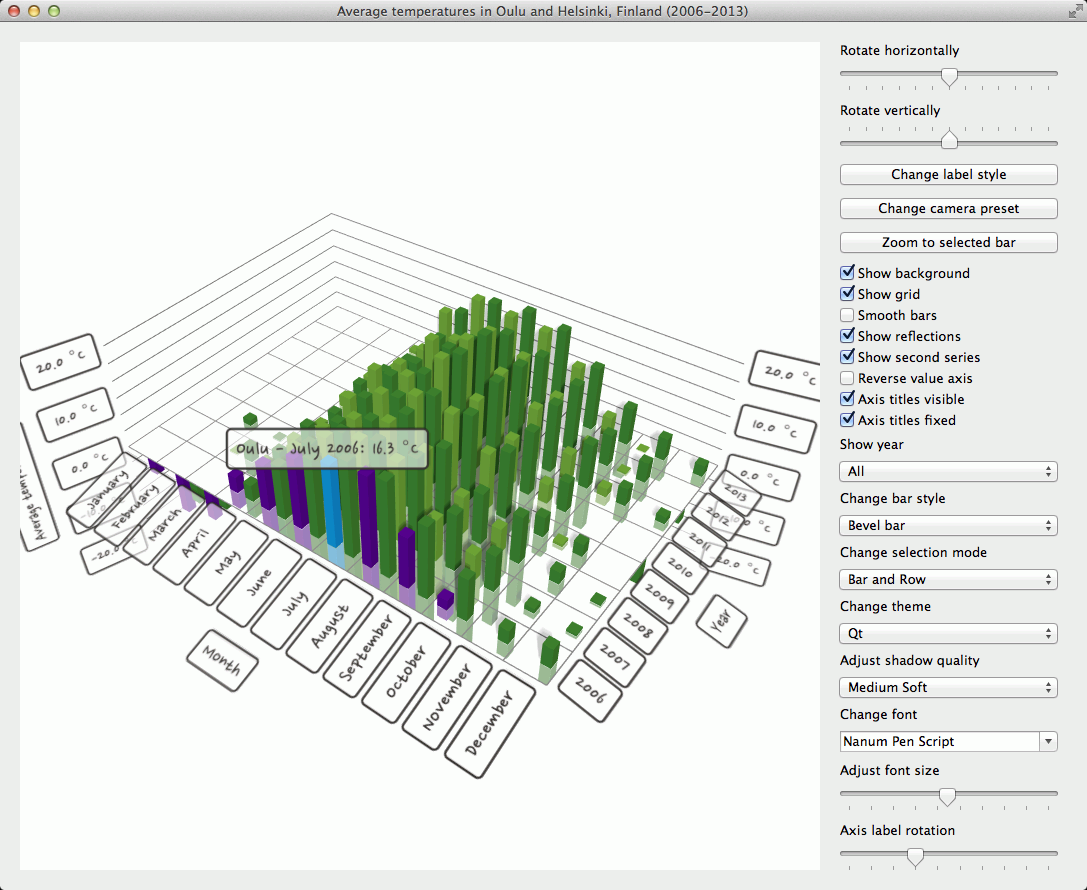
The bars example shows how to make a 3D bar graph using Q3DBars and combining the use of widgets for adjusting several adjustable qualities. The example shows how to:
It also demonstrates how having negative bar values affects the graph.
For instructions about how to interact with the graph, see this page .
要运行范例从 Qt Creator ,打开 欢迎 模式,然后选择范例从 范例 。更多信息,拜访 构建和运行范例 .
First, in main.cpp, we create a QApplication ,实例化 Q3DBars and a window container for it:
QApplication app(argc, argv);
Q3DBars *widgetgraph = new Q3DBars();
QWidget *container = QWidget::createWindowContainer(widgetgraph);
The call to QWidget::createWindowContainer is required, as all data visualization graph classes ( Q3DBars , Q3DScatter , Q3DSurface ) 继承 QWindow . Any class inheriting QWindow cannot be used as a widget any other way.
Then we'll create horizontal and vertical layouts. We'll add the graph and the vertical layout into the horizontal one:
QWidget *widget = new QWidget;
QHBoxLayout *hLayout = new QHBoxLayout(widget);
QVBoxLayout *vLayout = new QVBoxLayout();
hLayout->addWidget(container, 1);
hLayout->addLayout(vLayout);
We're not using the vertical layout for anything yet, but we'll get back to it in Using widgets to control the graph
Next, let's create another class to handle the data addition and other interaction with the graph. Let's call it
GraphModifier
(见
Setting up the graph
and
Adding data to the graph
了解细节):
GraphModifier *modifier = new GraphModifier(widgetgraph);
The application main is done and we can show the graph and start the event loop:
widget->show();
return app.exec();
Let's set up the graph in the constructor of the
GraphModifier
class we instantiated in the application main:
GraphModifier::GraphModifier(Q3DBars *bargraph)
    : m_graph(bargraph),
      m_xRotation(0.0f),
      m_yRotation(0.0f),
      m_fontSize(30),
      m_segments(4),
      m_subSegments(3),
      m_minval(-20.0f),
      m_maxval(20.0f),
      m_temperatureAxis(new QValue3DAxis),
      m_yearAxis(new QCategory3DAxis),
      m_monthAxis(new QCategory3DAxis),
      m_primarySeries(new QBar3DSeries),
      m_secondarySeries(new QBar3DSeries),
      m_barMesh(QAbstract3DSeries::MeshBevelBar),
      m_smooth(false)
{
    m_graph->setShadowQuality(QAbstract3DGraph::ShadowQualitySoftMedium);
    m_graph->activeTheme()->setBackgroundEnabled(false);
    m_graph->activeTheme()->setFont(QFont("Times New Roman", m_fontSize));
    m_graph->activeTheme()->setLabelBackgroundEnabled(true);
    m_graph->setMultiSeriesUniform(true);
    m_months << "January" << "February" << "March" << "April" << "May" << "June" << "July" << "August" << "September" << "October" << "November" << "December";
    m_years << "2006" << "2007" << "2008" << "2009" << "2010" << "2011" << "2012" << "2013";
    m_temperatureAxis->setTitle("Average temperature");
    m_temperatureAxis->setSegmentCount(m_segments);
    m_temperatureAxis->setSubSegmentCount(m_subSegments);
    m_temperatureAxis->setRange(m_minval, m_maxval);
    m_temperatureAxis->setLabelFormat(QString(QStringLiteral("%.1f ") + celsiusString));
    m_temperatureAxis->setLabelAutoRotation(30.0f);
    m_temperatureAxis->setTitleVisible(true);
    m_yearAxis->setTitle("Year");
    m_yearAxis->setLabelAutoRotation(30.0f);
    m_yearAxis->setTitleVisible(true);
    m_monthAxis->setTitle("Month");
    m_monthAxis->setLabelAutoRotation(30.0f);
    m_monthAxis->setTitleVisible(true);
    m_graph->setValueAxis(m_temperatureAxis);
    m_graph->setRowAxis(m_yearAxis);
    m_graph->setColumnAxis(m_monthAxis);
    m_primarySeries->setItemLabelFormat(QStringLiteral("Oulu - @colLabel @rowLabel: @valueLabel"));
    m_primarySeries->setMesh(QAbstract3DSeries::MeshBevelBar);
    m_primarySeries->setMeshSmooth(false);
    m_secondarySeries->setItemLabelFormat(QStringLiteral("Helsinki - @colLabel @rowLabel: @valueLabel"));
    m_secondarySeries->setMesh(QAbstract3DSeries::MeshBevelBar);
    m_secondarySeries->setMeshSmooth(false);
    m_secondarySeries->setVisible(false);
    m_graph->addSeries(m_primarySeries);
    m_graph->addSeries(m_secondarySeries);
    changePresetCamera();
    resetTemperatureData();
    // Set up property animations for zooming to the selected bar
    Q3DCamera *camera = m_graph->scene()->activeCamera();
    m_defaultAngleX = camera->xRotation();
    m_defaultAngleY = camera->yRotation();
    m_defaultZoom = camera->zoomLevel();
    m_defaultTarget = camera->target();
    m_animationCameraX.setTargetObject(camera);
    m_animationCameraY.setTargetObject(camera);
    m_animationCameraZoom.setTargetObject(camera);
    m_animationCameraTarget.setTargetObject(camera);
    m_animationCameraX.setPropertyName("xRotation");
    m_animationCameraY.setPropertyName("yRotation");
    m_animationCameraZoom.setPropertyName("zoomLevel");
    m_animationCameraTarget.setPropertyName("target");
    int duration = 1700;
    m_animationCameraX.setDuration(duration);
    m_animationCameraY.setDuration(duration);
    m_animationCameraZoom.setDuration(duration);
    m_animationCameraTarget.setDuration(duration);
    // The zoom always first zooms out above the graph and then zooms in
    qreal zoomOutFraction = 0.3;
    m_animationCameraX.setKeyValueAt(zoomOutFraction, QVariant::fromValue(0.0f));
    m_animationCameraY.setKeyValueAt(zoomOutFraction, QVariant::fromValue(90.0f));
    m_animationCameraZoom.setKeyValueAt(zoomOutFraction, QVariant::fromValue(50.0f));
    m_animationCameraTarget.setKeyValueAt(zoomOutFraction,
                                          QVariant::fromValue(QVector3D(0.0f, 0.0f, 0.0f)));
}
Let's take a closer look at parts of the code.
First we're creating the axes and the series into member variables to support changing them easily later on, if we want to:
m_temperatureAxis(new QValue3DAxis),
m_yearAxis(new QCategory3DAxis),
m_monthAxis(new QCategory3DAxis),
m_primarySeries(new QBar3DSeries),
m_secondarySeries(new QBar3DSeries),
Then we're setting some of the visual qualities for the graph:
m_graph->setShadowQuality(QAbstract3DGraph::ShadowQualitySoftMedium);
m_graph->activeTheme()->setBackgroundEnabled(false);
m_graph->activeTheme()->setFont(QFont("Times New Roman", m_fontSize));
m_graph->activeTheme()->setLabelBackgroundEnabled(true);
m_graph->setMultiSeriesUniform(true);
We're also setting up the axes and setting them to the graph as active axes:
m_temperatureAxis->setTitle("Average temperature");
m_temperatureAxis->setSegmentCount(m_segments);
m_temperatureAxis->setSubSegmentCount(m_subSegments);
m_temperatureAxis->setRange(m_minval, m_maxval);
m_temperatureAxis->setLabelFormat(QString(QStringLiteral("%.1f ") + celsiusString));
m_temperatureAxis->setLabelAutoRotation(30.0f);
m_temperatureAxis->setTitleVisible(true);
m_yearAxis->setTitle("Year");
m_yearAxis->setLabelAutoRotation(30.0f);
m_yearAxis->setTitleVisible(true);
m_monthAxis->setTitle("Month");
m_monthAxis->setLabelAutoRotation(30.0f);
m_monthAxis->setTitleVisible(true);
m_graph->setValueAxis(m_temperatureAxis);
m_graph->setRowAxis(m_yearAxis);
m_graph->setColumnAxis(m_monthAxis);
We give axis labels a small autorotation angle to make them orient somewhat toward the camera. This is done to improve axis label readability at extreme camera angles.
Next we initialize the visual properties of the series. Note that the second series is initially not visible:
m_primarySeries->setItemLabelFormat(QStringLiteral("Oulu - @colLabel @rowLabel: @valueLabel"));
m_primarySeries->setMesh(QAbstract3DSeries::MeshBevelBar);
m_primarySeries->setMeshSmooth(false);
m_secondarySeries->setItemLabelFormat(QStringLiteral("Helsinki - @colLabel @rowLabel: @valueLabel"));
m_secondarySeries->setMesh(QAbstract3DSeries::MeshBevelBar);
m_secondarySeries->setMeshSmooth(false);
m_secondarySeries->setVisible(false);
The series need to be added to the graph to show them:
m_graph->addSeries(m_primarySeries);
m_graph->addSeries(m_secondarySeries);
Finally, we set the camera angle by calling the same method the camera angle change button in the UI uses to cycle through various camera angles:
changePresetCamera();
There you can see that the camera is controlled via the scene object of the graph:
static int preset = Q3DCamera::CameraPresetFront;
m_graph->scene()->activeCamera()->setCameraPreset((Q3DCamera::CameraPreset)preset);
if (++preset > Q3DCamera::CameraPresetDirectlyBelow)
    preset = Q3DCamera::CameraPresetFrontLow;
For more information about using scene and cameras, see Q3DScene and Q3DCamera .
That concludes setting up the graph.
At the end of the constructor there's a call:
resetTemperatureData();
This method is used to add data to the proxies of the two series:
// Set up data
static const float tempOulu[8][12] = {
    {-6.7f, -11.7f, -9.7f, 3.3f, 9.2f, 14.0f, 16.3f, 17.8f, 10.2f, 2.1f, -2.6f, -0.3f},    // 2006
    {-6.8f, -13.3f, 0.2f, 1.5f, 7.9f, 13.4f, 16.1f, 15.5f, 8.2f, 5.4f, -2.6f, -0.8f},      // 2007
    {-4.2f, -4.0f, -4.6f, 1.9f, 7.3f, 12.5f, 15.0f, 12.8f, 7.6f, 5.1f, -0.9f, -1.3f},      // 2008
    {-7.8f, -8.8f, -4.2f, 0.7f, 9.3f, 13.2f, 15.8f, 15.5f, 11.2f, 0.6f, 0.7f, -8.4f},      // 2009
    {-14.4f, -12.1f, -7.0f, 2.3f, 11.0f, 12.6f, 18.8f, 13.8f, 9.4f, 3.9f, -5.6f, -13.0f},  // 2010
    {-9.0f, -15.2f, -3.8f, 2.6f, 8.3f, 15.9f, 18.6f, 14.9f, 11.1f, 5.3f, 1.8f, -0.2f},     // 2011
    {-8.7f, -11.3f, -2.3f, 0.4f, 7.5f, 12.2f, 16.4f, 14.1f, 9.2f, 3.1f, 0.3f, -12.1f},     // 2012
    {-7.9f, -5.3f, -9.1f, 0.8f, 11.6f, 16.6f, 15.9f, 15.5f, 11.2f, 4.0f, 0.1f, -1.9f}      // 2013
};
static const float tempHelsinki[8][12] = {
    {-3.7f, -7.8f, -5.4f, 3.4f, 10.7f, 15.4f, 18.6f, 18.7f, 14.3f, 8.5f, 2.9f, 4.1f},      // 2006
    {-1.2f, -7.5f, 3.1f, 5.5f, 10.3f, 15.9f, 17.4f, 17.9f, 11.2f, 7.3f, 1.1f, 0.5f},       // 2007
    {-0.6f, 1.2f, 0.2f, 6.3f, 10.2f, 13.8f, 18.1f, 15.1f, 10.1f, 9.4f, 2.5f, 0.4f},        // 2008
    {-2.9f, -3.5f, -0.9f, 4.7f, 10.9f, 14.0f, 17.4f, 16.8f, 13.2f, 4.1f, 2.6f, -2.3f},     // 2009
    {-10.2f, -8.0f, -1.9f, 6.6f, 11.3f, 14.5f, 21.0f, 18.8f, 12.6f, 6.1f, -0.5f, -7.3f},   // 2010
    {-4.4f, -9.1f, -2.0f, 5.5f, 9.9f, 15.6f, 20.8f, 17.8f, 13.4f, 8.9f, 3.6f, 1.5f},       // 2011
    {-3.5f, -3.2f, -0.7f, 4.0f, 11.1f, 13.4f, 17.3f, 15.8f, 13.1f, 6.4f, 4.1f, -5.1f},     // 2012
    {-4.8f, -1.8f, -5.0f, 2.9f, 12.8f, 17.2f, 18.0f, 17.1f, 12.5f, 7.5f, 4.5f, 2.3f}       // 2013
};
// Create data arrays
QBarDataArray *dataSet = new QBarDataArray;
QBarDataArray *dataSet2 = new QBarDataArray;
QBarDataRow *dataRow;
QBarDataRow *dataRow2;
dataSet->reserve(m_years.size());
for (int year = 0; year < m_years.size(); year++) {
    // Create a data row
    dataRow = new QBarDataRow(m_months.size());
    dataRow2 = new QBarDataRow(m_months.size());
    for (int month = 0; month < m_months.size(); month++) {
        // Add data to the row
        (*dataRow)[month].setValue(tempOulu[year][month]);
        (*dataRow2)[month].setValue(tempHelsinki[year][month]);
    }
    // Add the row to the set
    dataSet->append(dataRow);
    dataSet2->append(dataRow2);
}
// Add data to the data proxy (the data proxy assumes ownership of it)
m_primarySeries->dataProxy()->resetArray(dataSet, m_years, m_months);
m_secondarySeries->dataProxy()->resetArray(dataSet2, m_years, m_months);
Now the series have data to show.
There isn't much interaction yet, so let's continue by adding some widgets back in the application main. Let's just focus on two as an example:
QSlider *rotationSliderX = new QSlider(Qt::Horizontal, widget);
rotationSliderX->setTickInterval(30);
rotationSliderX->setTickPosition(QSlider::TicksBelow);
rotationSliderX->setMinimum(-180);
rotationSliderX->setValue(0);
rotationSliderX->setMaximum(180);
QSlider *rotationSliderY = new QSlider(Qt::Horizontal, widget);
rotationSliderY->setTickInterval(15);
rotationSliderY->setTickPosition(QSlider::TicksAbove);
rotationSliderY->setMinimum(-90);
rotationSliderY->setValue(0);
rotationSliderY->setMaximum(90);
We can use these slider widgets to rotate the graph instead of just using the mouse or touch.
Let's add them to the vertical layout we created earlier:
vLayout->addWidget(new QLabel(QStringLiteral("Rotate horizontally")));
vLayout->addWidget(rotationSliderX, 0, Qt::AlignTop);
vLayout->addWidget(new QLabel(QStringLiteral("Rotate vertically")));
vLayout->addWidget(rotationSliderY, 0, Qt::AlignTop);
Then we'll connect them to methods in
GraphModifier
:
QObject::connect(rotationSliderX, &QSlider::valueChanged, modifier, &GraphModifier::rotateX);
QObject::connect(rotationSliderY, &QSlider::valueChanged, modifier, &GraphModifier::rotateY);
Here are the methods in
GraphModifier
the signals were connected to. The camera is controlled via the scene object. This time we specify the actual camera position along the orbit around the center point, instead of specifying a preset camera angle:
void GraphModifier::rotateX(int rotation)
{
    m_xRotation = rotation;
    m_graph->scene()->activeCamera()->setCameraPosition(m_xRotation, m_yRotation);
}
void GraphModifier::rotateY(int rotation)
{
    m_yRotation = rotation;
    m_graph->scene()->activeCamera()->setCameraPosition(m_xRotation, m_yRotation);
}
Now these two sliders can be used to rotate the graph.
And so we have an application in which we can control:
Selection by axis label is default functionality for bar graphs. As an example, you can select rows by clicking an axis label in the following way:
SelectionRow
You can use the same method with
SelectionSlice
and
SelectionItem
flags, as long as you have either
SelectionRow
or
SelectionColumn
set as well.
As an example of adjusting camera target we have implemented an animation of zooming to selection via a button press. Animation initializations are done in the constructor:
Q3DCamera *camera = m_graph->scene()->activeCamera();
m_defaultAngleX = camera->xRotation();
m_defaultAngleY = camera->yRotation();
m_defaultZoom = camera->zoomLevel();
m_defaultTarget = camera->target();
m_animationCameraX.setTargetObject(camera);
m_animationCameraY.setTargetObject(camera);
m_animationCameraZoom.setTargetObject(camera);
m_animationCameraTarget.setTargetObject(camera);
m_animationCameraX.setPropertyName("xRotation");
m_animationCameraY.setPropertyName("yRotation");
m_animationCameraZoom.setPropertyName("zoomLevel");
m_animationCameraTarget.setPropertyName("target");
int duration = 1700;
m_animationCameraX.setDuration(duration);
m_animationCameraY.setDuration(duration);
m_animationCameraZoom.setDuration(duration);
m_animationCameraTarget.setDuration(duration);
// The zoom always first zooms out above the graph and then zooms in
qreal zoomOutFraction = 0.3;
m_animationCameraX.setKeyValueAt(zoomOutFraction, QVariant::fromValue(0.0f));
m_animationCameraY.setKeyValueAt(zoomOutFraction, QVariant::fromValue(90.0f));
m_animationCameraZoom.setKeyValueAt(zoomOutFraction, QVariant::fromValue(50.0f));
m_animationCameraTarget.setKeyValueAt(zoomOutFraction,
                                      QVariant::fromValue(QVector3D(0.0f, 0.0f, 0.0f)));
函数
GraphModifier::zoomToSelectedBar()
contains the rest of the functionality:
void GraphModifier::zoomToSelectedBar()
{
    m_animationCameraX.stop();
    m_animationCameraY.stop();
    m_animationCameraZoom.stop();
    m_animationCameraTarget.stop();
    Q3DCamera *camera = m_graph->scene()->activeCamera();
    float currentX = camera->xRotation();
    float currentY = camera->yRotation();
    float currentZoom = camera->zoomLevel();
    QVector3D currentTarget = camera->target();
    m_animationCameraX.setStartValue(QVariant::fromValue(currentX));
    m_animationCameraY.setStartValue(QVariant::fromValue(currentY));
    m_animationCameraZoom.setStartValue(QVariant::fromValue(currentZoom));
    m_animationCameraTarget.setStartValue(QVariant::fromValue(currentTarget));
    QPoint selectedBar = m_graph->selectedSeries()
            ? m_graph->selectedSeries()->selectedBar()
            : QBar3DSeries::invalidSelectionPosition();
    if (selectedBar != QBar3DSeries::invalidSelectionPosition()) {
        // Normalize selected bar position within axis range to determine target coordinates
        QVector3D endTarget;
        float xMin = m_graph->columnAxis()->min();
        float xRange = m_graph->columnAxis()->max() - xMin;
        float zMin = m_graph->rowAxis()->min();
        float zRange = m_graph->rowAxis()->max() - zMin;
        endTarget.setX((selectedBar.y() - xMin) / xRange * 2.0f - 1.0f);
        endTarget.setZ((selectedBar.x() - zMin) / zRange * 2.0f - 1.0f);
        // Rotate the camera so that it always points approximately to the graph center
        qreal endAngleX = qAtan(qreal(endTarget.z() / endTarget.x())) / M_PI * -180.0 + 90.0;
        if (endTarget.x() > 0.0f)
            endAngleX -= 180.0f;
        float barValue = m_graph->selectedSeries()->dataProxy()->itemAt(selectedBar.x(),
                                                                        selectedBar.y())->value();
        float endAngleY = barValue >= 0.0f ? 30.0f : -30.0f;
        if (m_graph->valueAxis()->reversed())
            endAngleY *= -1.0f;
        m_animationCameraX.setEndValue(QVariant::fromValue(float(endAngleX)));
        m_animationCameraY.setEndValue(QVariant::fromValue(endAngleY));
        m_animationCameraZoom.setEndValue(QVariant::fromValue(250));
        m_animationCameraTarget.setEndValue(QVariant::fromValue(endTarget));
    } else {
        // No selected bar, so return to the default view
        m_animationCameraX.setEndValue(QVariant::fromValue(m_defaultAngleX));
        m_animationCameraY.setEndValue(QVariant::fromValue(m_defaultAngleY));
        m_animationCameraZoom.setEndValue(QVariant::fromValue(m_defaultZoom));
        m_animationCameraTarget.setEndValue(QVariant::fromValue(m_defaultTarget));
    }
    m_animationCameraX.start();
    m_animationCameraY.start();
    m_animationCameraZoom.start();
    m_animationCameraTarget.start();
}
The
QPropertyAnimation
m_animationCameraTarget
目标
Q3DCamera::target
property, which takes a value normalized to the range (-1, 1). We figure out where the selected bar is relative to axes, and use that as the end value for
m_animationCameraTarget
:
QVector3D endTarget;
float xMin = m_graph->columnAxis()->min();
float xRange = m_graph->columnAxis()->max() - xMin;
float zMin = m_graph->rowAxis()->min();
float zRange = m_graph->rowAxis()->max() - zMin;
endTarget.setX((selectedBar.y() - xMin) / xRange * 2.0f - 1.0f);
endTarget.setZ((selectedBar.x() - zMin) / zRange * 2.0f - 1.0f);
    ...
m_animationCameraTarget.setEndValue(QVariant::fromValue(endTarget));
Likewise, we want to angle the camera so that it always points approximately to the center of the graph at the end of the animation:
qreal endAngleX = qAtan(qreal(endTarget.z() / endTarget.x())) / M_PI * -180.0 + 90.0;
if (endTarget.x() > 0.0f)
    endAngleX -= 180.0f;
float barValue = m_graph->selectedSeries()->dataProxy()->itemAt(selectedBar.x(),
                                                                selectedBar.y())->value();
float endAngleY = barValue >= 0.0f ? 30.0f : -30.0f;
if (m_graph->valueAxis()->reversed())
    endAngleY *= -1.0f;
文件: